News
End of Season Field Reports
2006-2007 Field Season
Detection of Crystal Orientation Fabrics in the Divide Region Using Polarimetric Radar Methods (I-163)
NSF-OPP supported
PI: Charles Raymond and Kenichi Matsuoka (University of Washington)
Field Team:
| Kenichi Matsuoka | Vanessa Palmer | |
| Donovan Power | Maurice Conway | |
| Hans Christian Steen-Larsen | ||
Season Overview:
The top ~200 m of the ice sheet was investigated using a polarimetric radar method. Strain grids that were installed last season were reoccupied using GPS. This project aims to detect alignment of crystals in ice (ice fabrics) using ice-penetrating radar. As ice deforms, ice fabrics are produced, which, in turn, influence further deformation. Consequently, measurements of fabric variations can help reveal the deformation history of the ice and indicate how the ice will deform in the future. The polarimetric radar measurement is the most feasible way to determine horizontal variations of ice fabrics.
This season, 1.3-GHz (L band) radar was used to examine the top ~200 m with a high (0.6 m) vertical resolution. This depth range was not observed in the last season using 60-MHz and 179-MHz radar systems, because measurements down to about 2500 m depth requires transmission of powerful radio wave which prevents investigation of the near surface close to the radar system. Radar measurements of the shallow ice are essential to clarify whether anisotropic features at greater depths are caused by ice strain (within the ice) or by near-surface depositional processes. The radar system was housed in a Faraday cage on a Komotek sled and towed by a skidoo (Fig. 1). A new antenna configuration was installed on the housing used last season (Franken sled). At nineteen sites shown in Figure 2, the azimuth of the sled was changed by 15o intervals. Radar data were collected for each azimuth so that we can see how the radio-echo intensity varies with the polarization. Radar profiling was also made to connect all of these sites.
Each strain grid consists of five markers several kilometers away from each other. Reoccupation of markers installed one year ago gives local-mean ice-flow velocity and stain in the vicinity. The strain grids were installed and reoccupied at all polarimetric radar measurement sites and two other sites. This strain configuration enables us to simulate fabric development under the current glaciological conditions. The simulated fabric will be used as a reference to interpret anisotropic features found in radar data.
All radar and GPS measurements were made successfully and the data is currently being analyzed.
The field team of five personnel arrived in McMurdo early December. The Franken sled radar system was adapted and tested on the ice shelf near McMurdo. It took about three weeks. The field team was deployed to the WAIS Divide camp on December 27th. After the preparation and day trips to sites within about 30 - 50 km from the divide camp, the team made a 600-mile-long traverse for about a month. The traverse was completed January 22nd and all team members were returned to McMurdo on January 26th. More information about the project including the view of fresh eyes of first-comer students (web journal with photos) can be found at http://www.ess.washington.edu/matsuoka/wais/wais.html
Acknowledgements:
The radar system was loaned to us by Dr. Shuji Fujita at the National Institute of Polar Research, Tokyo, as a part of collaborative research. Special thanks go to WAIS Divide camp staff led by Ben Partan, science construction staff led by Woody Haywood, and NSF support led by Julie Palais. This project is supported by NSF OPP-0440847.
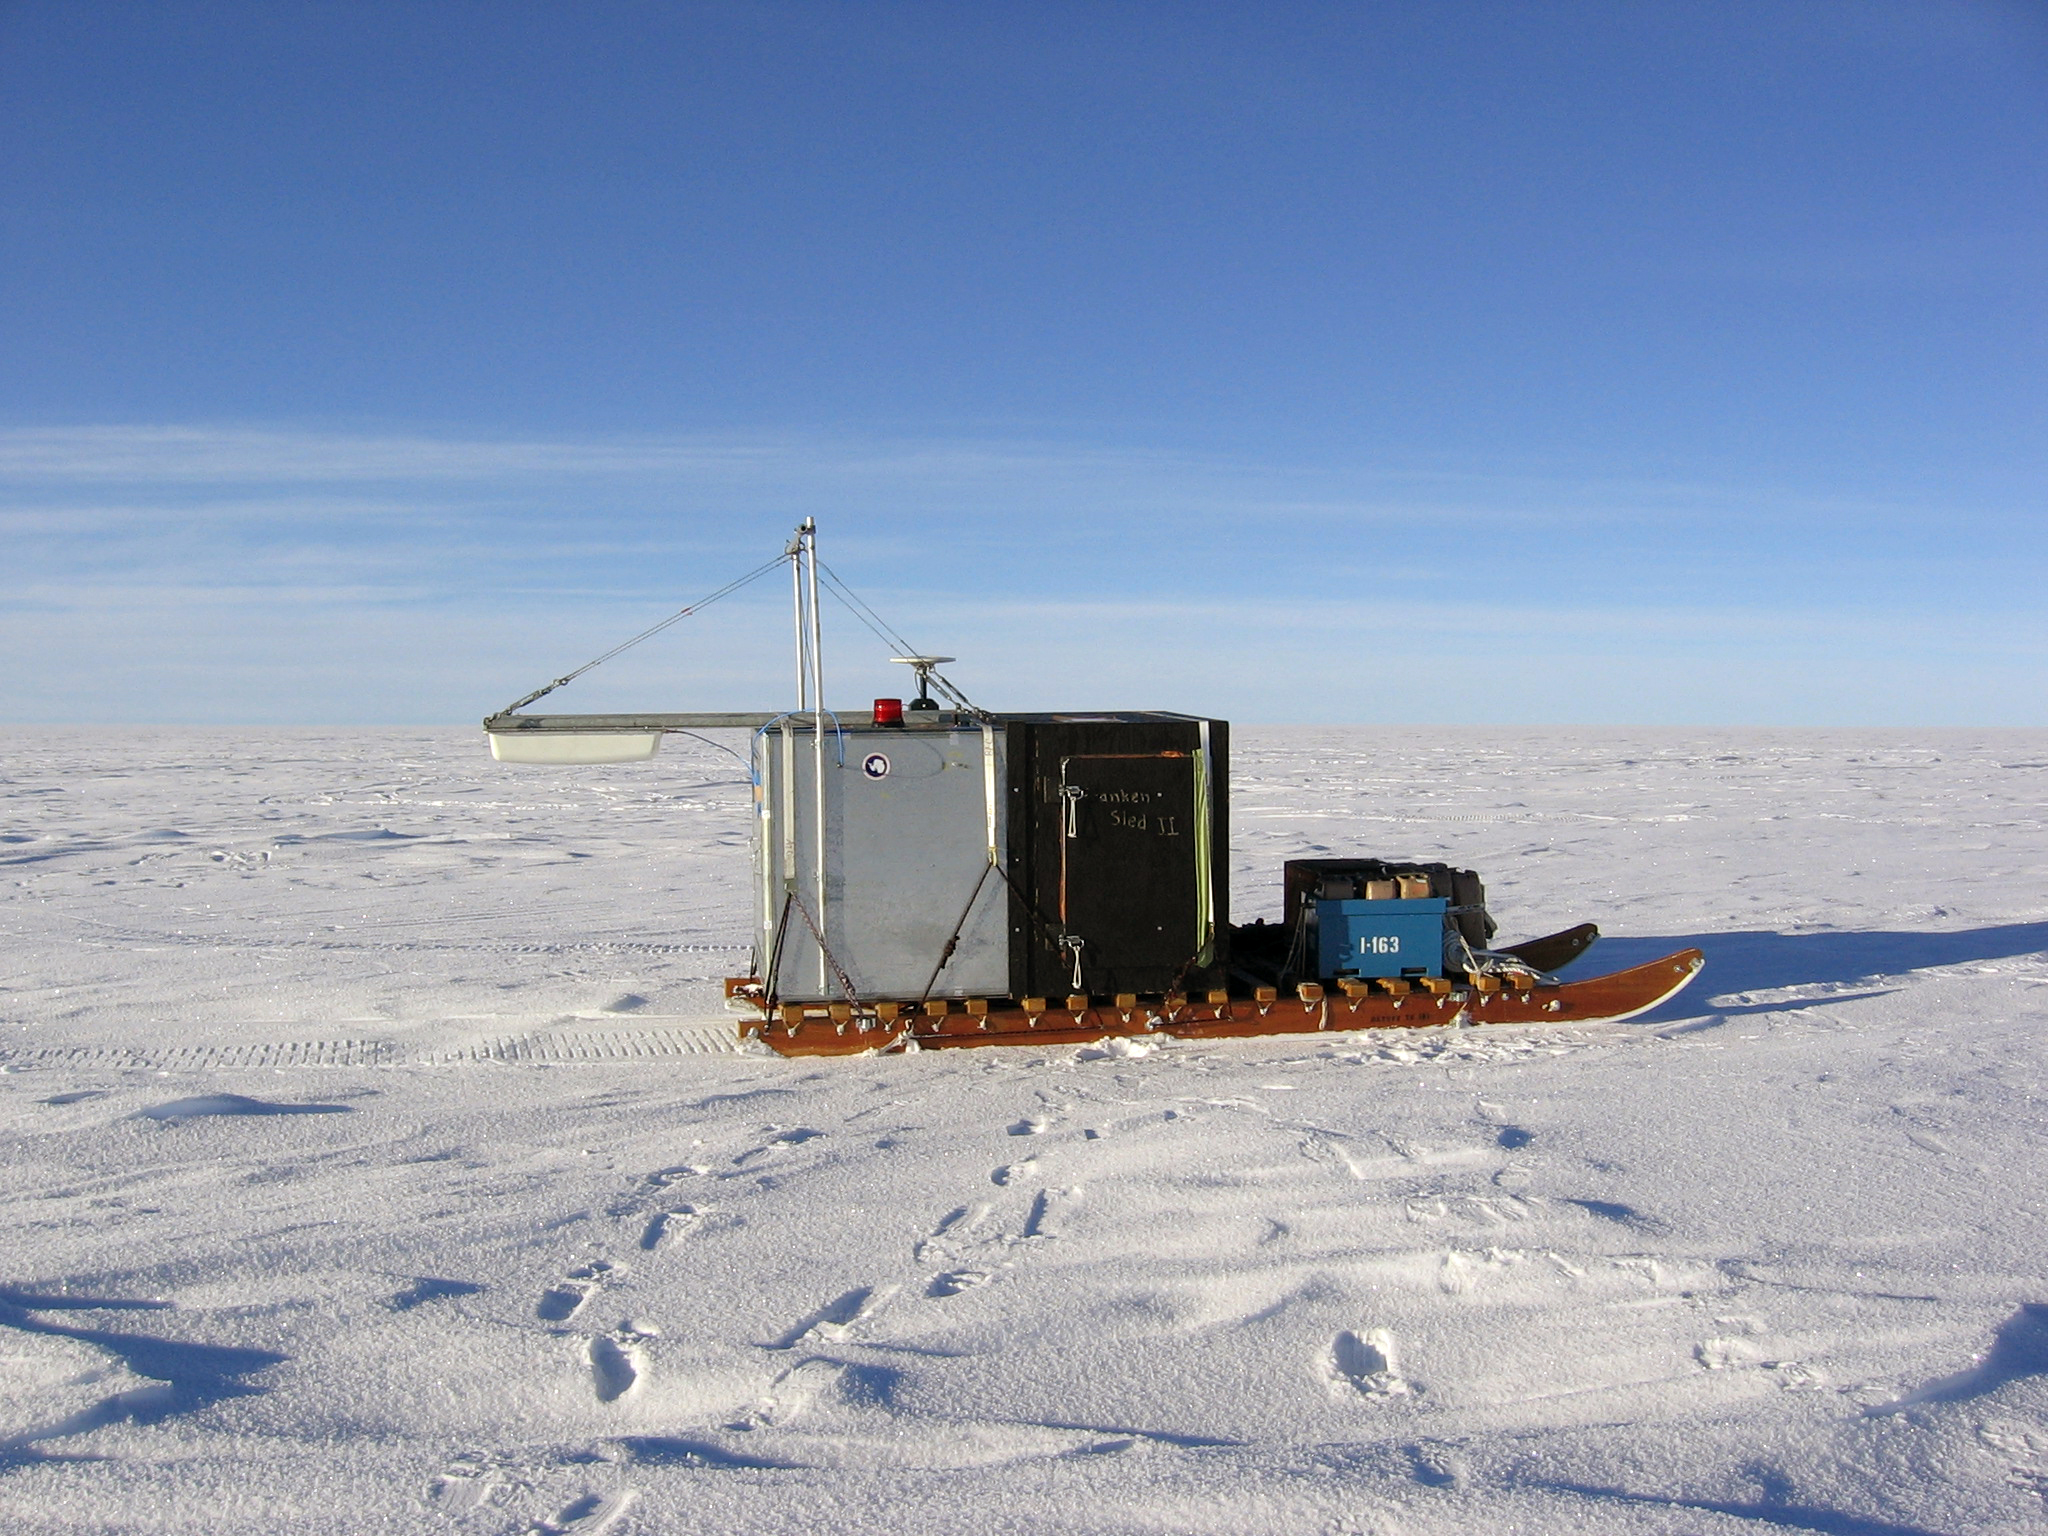
Fig. 1: 1.3-GHz radar system on a 16-foot-long Komotek sled. The antennae are attached to the aluminum plate rear the sled and looks down. The grey Faraday cage houses the radar system. The front black part hosts an operator during the polarimetric measurements. Other components include a GPS antenna (white, roof), a lamp letting us know system errors (red, roof), a fuel cradle (blue, front), and a generator box (behind the fuel cradle).
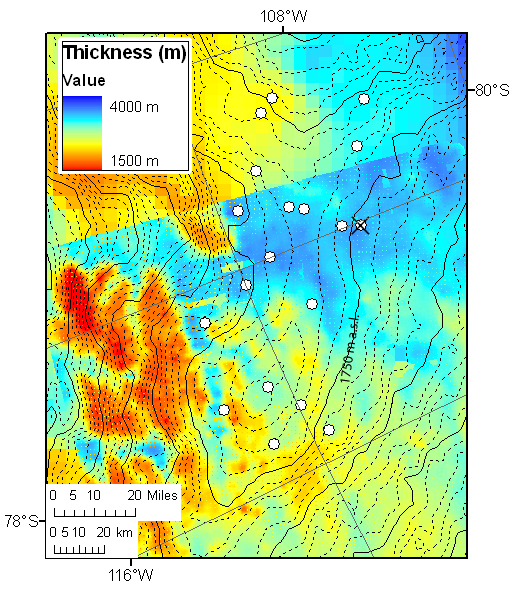
Fig. 2: Location of polarimetric radar measurements (open circles). A cross shows the divide camp. Contour lines show the elevation (a.s.l.) of ice-sheet surface by 10 m (dashed lines) and by 50 m (solid lines). Background color indicates the ice thickness compiled from SOAR and BEDMAP databases.
